SQL Server – Query to get drive free space from SQL Server

Question:

How can I query SQL Server to get the drive space free, drive space used and total drive size.

Answer:

Beginning with SQL Server 2008R2 Microsoft introduced a new system DMF (dynamic management function) named sys.dm_os_volume_stats.  This DMF returns information about the operating system volume (directory) on which the specified databases and files are stored in SQL Server. You can use this dynamic management function to check the attributes of the physical disk drive or return available free space information about the directory.

This DMF takes two arguments:

  1. database_id – The ID of the database. database_id is int, with no default. Cannot be NULL.
  2. file_id – The ID of the file. file_id is int, with no default. Cannot be NULL.

You can join this DMF to the sys.master_files DMV to get the drive space usage statistics for the drives where you have a database file stored.


-----------------------------------------

select distinct
convert(varchar(512), b.volume_mount_point) as [volume_mount_point]
, convert(varchar(512), b.logical_volume_name) as [logical_volume_name]
, convert(decimal(18,1), round(((convert(float, b.available_bytes) / convert(float, b.total_bytes)) * 100),1)) as [percent_free]
, convert(bigint, round(((b.available_bytes / 1024.0)/1024.0),0)) as [free_mb]
, convert(bigint, round(((b.total_bytes / 1024.0)/1024.0),0)) as [total_mb]
, convert(bigint, round((((b.total_bytes - b.available_bytes) / 1024.0)/1024.0),0)) as [used_mb]
from sys.master_files as [a]
CROSS APPLY sys.dm_os_volume_stats(a.database_id, a.[file_id]) as [b]

-----------------------------------------

Here are the results:

DriveSpace

** One word of caution is that sys.dm_os_volume_stats will only produce stats for drives where a SQL Server database exists.


Another question: But… what if I am using SQL Server 2008 or older?

Another Answer: xp_fixeddrives

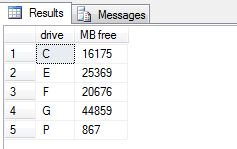
This extended stored procedure is not as useful regarding the information that it gives – only showing free space.  However, it DOES include all of the fixed drives on the server instead of just the drives where a SQL Server database exists.


------------------------------------

exec master.dbo.xp_fixeddrives

------------------------------------

Here are the results:

DriveSpace2

SQL Query to Get SQL Server CPU Utilization

For a quick and dirty way to get the CPU utilization from SQL Server you can use the sys.dm_os_ring_buffers DMV.

The DMV sys.dm_os_ring_buffers maintains approximately 1000 records, before wrapping around and replacing the oldest entries first. It exposes four columns but we’re primarily only interested in one of them, record, which contains XML data.

Here is a quick query to get CPU utilization from the SQL Server.


-------------------------------------------

select top 1
(convert(xml, record)).value('(./Record/SchedulerMonitorEvent/SystemHealth/SystemIdle)[1]', 'int') as [cpuIdle],
(convert(xml, record)).value('(./Record/SchedulerMonitorEvent/SystemHealth/ProcessUtilization)[1]', 'int') as [cpuSQLProcessUtilization],
100 - (convert(xml, record)).value('(./Record/SchedulerMonitorEvent/SystemHealth/SystemIdle)[1]', 'int') - (convert(xml, record)).value('(./Record/SchedulerMonitorEvent/SystemHealth/ProcessUtilization)[1]', 'int') as [CPUOtherProcessUtilization]

from sys.dm_os_ring_buffers a
where a.ring_buffer_type = N'RING_BUFFER_SCHEDULER_MONITOR'
and a.record like '%<SystemHealth>%'
order by (convert(xml, record)).value('(./Record/@id)[1]', 'int') desc;

--------------------------------------------

Executing the above query will give you a result similar to the following:

CPUUtilization

One caveat about using this method though is that the ring buffer reports CPU usage once per minute.  This means that this is not necessarily “real time”, but will always be within 1 minute or less of the moment when the query was executed.

If you wanted to get the CPU usage for the last ten minutes you could take the above query and change the ‘top’ clause from a 1 to a 10.  Like so:


-------------------------------------------

select top 10
(convert(xml, record)).value('(./Record/SchedulerMonitorEvent/SystemHealth/SystemIdle)[1]', 'int') as [cpuIdle],
(convert(xml, record)).value('(./Record/SchedulerMonitorEvent/SystemHealth/ProcessUtilization)[1]', 'int') as [cpuSQLProcessUtilization],
100 - (convert(xml, record)).value('(./Record/SchedulerMonitorEvent/SystemHealth/SystemIdle)[1]', 'int') - (convert(xml, record)).value('(./Record/SchedulerMonitorEvent/SystemHealth/ProcessUtilization)[1]', 'int') as [CPUOtherProcessUtilization]

from sys.dm_os_ring_buffers a
where a.ring_buffer_type = N'RING_BUFFER_SCHEDULER_MONITOR'
and a.record like '%<SystemHealth>%'
order by (convert(xml, record)).value('(./Record/@id)[1]', 'int') desc;

--------------------------------------------

As you can see from the screen shot below we now receive the CPU usage statistics for the last 10 minutes.

CPUUtilization2

How do I find statements that are currently executing in SQL Server?

Question:

How do I find the statements that are executing in SQL Server?

Answer:

For such a task Microsoft has been kind enough to provide us with some pretty handy DMVs (Dynamic Management Views).
Below we will use the following DMVs and Table-valued functions:

  1. sys.dm_exec_requests – Returns information about each request that is executing within SQL Server.
  2. sys.dm_exec_sql_text – A table-valued function that returns the text of the SQL batch that is identified by the specified sql_handle. This table-valued function replaces the system function fn_get_sql. We can use this to get the text of the full batch as well as the specific currently executing statement within the batch.
  3. sys.dm_exec_query_plan – A table-valued function that returns the Showplan in XML format for the batch specified by the plan handle. The plan specified by the plan handle can either be cached or currently executing.
  4. sys.dm_exec_sessions – Returns one row per authenticated session on SQL Server. sys.dm_exec_sessions is a server-scope view that shows information about all active user connections and internal tasks.

Here is a query that I like to use to find the currently executing statements in SQL Server:

-----------------------------------------------------
select
  a.session_id
, a.blocking_session_id
, a.wait_type
, a.wait_resource
, a.wait_time
, a.start_time
, datediff(second, a.start_time, getdate()) as [duration_second]
, d.login_time
, d.last_request_start_time
, d.[status]
, d.login_name
, d.nt_domain
, d.nt_user_name
, d.[host_name]
, d.[program_name]

, DB_NAME(a.database_id) AS [database_name]
, OBJECT_SCHEMA_NAME(b.objectid, a.database_id) AS [schema_name]
, OBJECT_NAME(b.objectid, a.database_id) AS [object_name]

, b.[text] AS [FullSQLBatch]
, CASE a.statement_end_offset
			WHEN -1 THEN SUBSTRING(b.[text], (a.[statement_start_offset] / 2) + 1, 2147483647)
			WHEN 0 THEN b.[text]
			ELSE SUBSTRING(b.[text], (a.[statement_start_offset] / 2) + 1, (a.[statement_end_offset] - a.[statement_start_offset]) / 2)
			END AS [ActiveStatement]
, c.query_plan

, a.open_transaction_count
, a.open_resultset_count
, a.percent_complete
, a.reads
, a.writes
, a.logical_reads
, a.granted_query_memory

FROM sys.dm_exec_requests AS a
   OUTER APPLY sys.dm_exec_sql_text(a.[sql_handle]) AS b
   OUTER APPLY sys.dm_exec_query_plan(a.plan_handle) AS c
   LEFT JOIN sys.dm_exec_sessions AS d ON a.session_id = d.session_id
WHERE a.session_id >= 50
  and a.session_id <> @@spid
-----------------------------------------------------


Here is another iteration of the above statement. This one will also include information about the blocker (if there is one).

<pre>-----------------------------------------------------
select
  a.session_id
, a.blocking_session_id
, a.wait_type
, a.wait_resource
, a.wait_time
, a.start_time
, datediff(second, a.start_time, getdate()) as [duration_second]
, d.login_time
, d.last_request_start_time
, d.[status]
, d.login_name
, d.nt_domain
, d.nt_user_name
, d.[host_name]
, d.[program_name]

, DB_NAME(a.database_id) AS [database_name]
, OBJECT_SCHEMA_NAME(b.objectid, a.database_id) AS [schema_name]
, OBJECT_NAME(b.objectid, a.database_id) AS [object_name]

, b.[text] AS [FullSQLBatch]
, CASE a.statement_end_offset
			WHEN -1 THEN SUBSTRING(b.[text], (a.[statement_start_offset] / 2) + 1, 2147483647)
			WHEN 0 THEN b.[text]
			ELSE SUBSTRING(b.[text], (a.[statement_start_offset] / 2) + 1, (a.[statement_end_offset] - a.[statement_start_offset]) / 2)
			END AS [ActiveStatement]
, c.query_plan

, a.open_transaction_count
, a.open_resultset_count
, a.percent_complete
, a.reads
, a.writes
, a.logical_reads
, a.granted_query_memory

, '***** blocker info *****' as [***** blocker info *****]
, f.session_id as [blocker_session_id]
, f.blocking_session_id as [blocker_blocking_session_id]
, f.wait_type as [blocker_wait_type]
, f.wait_resource
, f.wait_time as [blocker_wait_time]
, f.start_time as [blocker_start_time]
, datediff(second, f.start_time, getdate()) as [blocker_duration_second]
, e.login_time as [blocker_login_time]
, e.last_request_start_time as [blocker_last_request_start_time]
, e.[status] as [blocker_status]
, e.login_name as [blocker_login_name]
, e.nt_domain as [blocker_nt_domain]
, e.nt_user_name as [blocker_nt_user_name]
, e.[host_name] as [blocker_host_name]
, e.[program_name] as [blocker_program_name]

, DB_NAME(f.database_id) AS [blocker_database_name]
, OBJECT_SCHEMA_NAME(h.objectid, f.database_id) AS [blocker_schema_name]
, OBJECT_NAME(h.objectid, f.database_id) AS [blocker_object_name]

, h.[text] AS [blocker_FullSQLBatch]
, CASE f.statement_end_offset
			WHEN -1 THEN SUBSTRING(h.[text], (f.[statement_start_offset] / 2) + 1, 2147483647)
			WHEN 0 THEN h.[text]
			ELSE SUBSTRING(h.[text], (f.[statement_start_offset] / 2) + 1, (f.[statement_end_offset] - f.[statement_start_offset]) / 2)
			END AS [blocker_ActiveStatement]
, g.query_plan as [blocker_query_plan]

, f.open_transaction_count as [blocker_open_transaction_count]
, f.open_resultset_count as [blocker_open_resultset_count]
, f.percent_complete as [blocker_percent_complete]
, f.reads as [blocker_reads]
, f.writes as [blocker_writes]
, f.logical_reads as [blocker_logical_reads]
, f.granted_query_memory as [blocker_granted_query_memory]

FROM sys.dm_exec_requests AS a
    OUTER APPLY sys.dm_exec_sql_text(a.[sql_handle]) AS b
    OUTER APPLY sys.dm_exec_query_plan(a.plan_handle) AS c
    LEFT JOIN sys.dm_exec_sessions AS d ON a.session_id = d.session_id

    left outer join sys.dm_exec_sessions as [e] on e.session_id = a.blocking_session_id
    left outer join sys.dm_exec_requests as [f] on f.session_id = a.blocking_session_id
    outer apply sys.dm_exec_query_plan(f.plan_handle) as [g]
    outer apply sys.dm_exec_sql_text(f.[sql_handle]) as [h]
WHERE a.session_id >= 50
  and a.session_id <> @@spid
-----------------------------------------------------


Three simple ways to use a SQL query to return the text of your stored procedure, function, view, etc.

Below are three simple ways to use a SQL query to get the text of a stored procedure, trigger, function, etc.

Method #1: SYS.SQL_MODULES

sys.sql_modules is a system DMV (Dynamic Management View) that returns a row for each object that is an SQL language-defined module in SQL Server. Objects of type P, RF, V, TR, FN, IF, TF, and R have an associated SQL module.

Here is an example:

-----------------------------------
select a.[definition] from sys.sql_modules as [a]
 join sys.objects as [b] on b.[object_id] = a.[object_id]
where b.name = 'YourStoredProcedureName';
-----------------------------------


Method #2: sp_helptext

sp_helptext is a built-in stored procedure that displays the definition of a user-defined rule, default, unencrypted Transact-SQL stored procedure, user-defined Transact-SQL function, trigger, computed column, CHECK constraint, view, or system object such as a system stored procedure.

Here is an example:

-----------------------------------
exec sp_helptext @objname = 'YourStoredProcedureName';
-----------------------------------


Method #3: sys.syscomments

sys.syscomments contains entries for each view, rule, default, trigger, CHECK constraint, DEFAULT constraint, and stored procedure within the database. The text column contains the original SQL definition statements.

Here is an example:

-----------------------------------
select a.[text] from sys.syscomments as [a]
 join sys.sysobjects as [b] on b.id = a.id
where b.name = 'YourStoredProcedureName';
-----------------------------------

SQL Script to set the database recovery model in SQL Server

If you would like to change the database recovery model on your SQL Server database you can use the ALTER DATABASE command.

To set your database recovery model to full you can execute the following statement:

-----------------------------------
ALTER DATABASE [test] SET RECOVERY FULL WITH NO_WAIT;
-----------------------------------

To set your database recovery model to simple you can execute the following statement:

-----------------------------------
ALTER DATABASE [test] SET RECOVERY SIMPLE WITH NO_WAIT;
-----------------------------------

To set your database recovery model to bulk logged you can execute the following statement:

-----------------------------------
ALTER DATABASE [test] SET RECOVERY BULK_LOGGED WITH NO_WAIT;
-----------------------------------